Debugging an iOS app is a crucial skill for any developer, essential for identifying and resolving issues that prevent an application from functioning correctly. It’s the process of methodically investigating, analyzing, and removing bugs (errors, flaws, or faults) from the software.
Why Debugging is Important
Bugs can manifest in various ways, from simple visual glitches and unexpected crashes to incorrect data handling and security vulnerabilities. Effective debugging ensures your app is:
- Reliable: It performs as expected under various conditions.
- Stable: It doesn’t crash or freeze unexpectedly.
- Performant: It runs efficiently without unnecessary resource usage.
- User Friendly: It provides a smooth and correct experience for the end-user.
Key Tools in iOS Debugging
The primary environment for iOS development and debugging is Xcode, Apple’s Integrated Development Environment (IDE). Xcode provides a powerful suite of tools specifically designed to help developers track down and fix issues:
- Breakpoints: Allow you to pause the execution of your code at a specific line to inspect the state of variables and the call stack.
- The Debugger Console: Displays output from your app (like print() statements) and crucial error messages.
- Variable View: A window within the debugging area that shows the current value of all variables in scope when execution is paused.
- Instruments: A separate application included with Xcode used for profiling, analyzing performance, and detecting memory leaks.
- Log Files and Crash Reports: Provide records of your app’s behavior, especially important for diagnosing issues that occur outside the debugger (like on a user’s device).
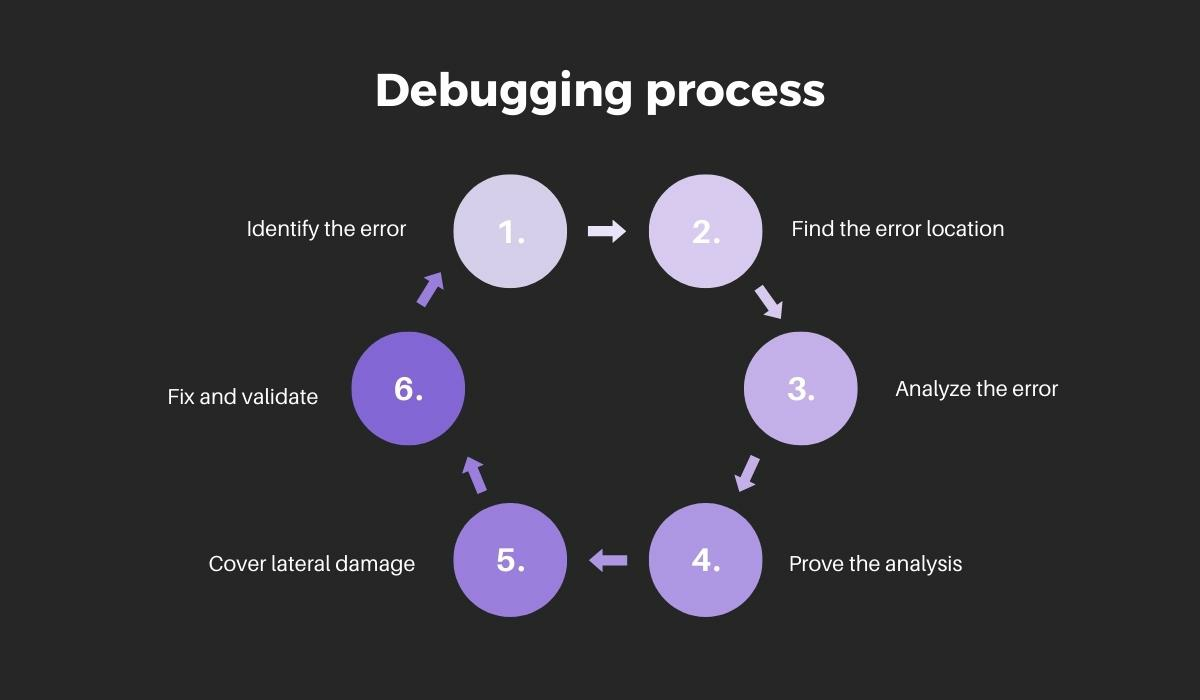
The Basic Debugging Workflow
While the process can be complex, a typical debugging session often follows these steps:
- Reproduce the Bug: Consistently identify the steps that cause the error to occur.
- Localize the Code: Use print statements or breakpoints to narrow down the exact area of code where the error originates.
- Inspect the State: Pause execution with a breakpoint and examine variables, function calls, and object properties to understand why the code is behaving unexpectedly.
- Formulate a Hypothesis: Based on your inspection, determine the probable cause of the bug (e.g., an uninitialized variable, an incorrect calculation, or a threading issue).
- Fix the Bug: Apply the necessary code changes.
- Test and Verify: Run the app and confirm that the original issue is resolved and that no new bugs (regressions) have been introduced.
Let’s talk about What’s Involved With the iOS App Debugging Process
The introduction provided a great overview of iOS app debugging. To discuss what’s involved with the iOS App Debugging Process in more detail, we can break it down into several core phases, techniques, and specialized tools beyond the basics.
1. Preparation and Setup
Before any active debugging, proper setup is key:
- Clean Build: Ensure the project has been built successfully and cleanly. A Product → Clean Build Folder operation can sometimes resolve transient, confusing issues.
- Symbolication: Verify that debug symbols are correctly generated and available. Symbols map the compiled machine code back to the original source code, allowing the debugger to show you the exact line of Swift/Objective-C where an issue occurred.
- Appropriate Environment: Debugging should be done on the intended target either the iOS Simulator or a physical device—as certain bugs (especially related to memory, threading, or hardware access) may only appear on one or the other.
2. Reproduction and Isolation
The most critical initial step is consistent reproduction of the issue:
- Define the Steps: Document the exact sequence of user actions, data inputs, and conditions (e.g., network state, background activity) that reliably trigger the bug. If it cannot be reproduced, it cannot be fixed.
- Binary Search Debugging (Bisection): If the bug’s origin is unclear, a powerful technique is to use breakpoints to repeatedly narrow the search area by half. Start a breakpoint halfway through the suspected code block; if the issue happens before the breakpoint, the bug is in the first half; if it happens after, it’s in the second.
- Logging and print() Statements: While basic, strategic use of print() statements or os_log (Apple’s modern logging framework) helps confirm the execution path and the values of key variables at specific points.
3. Active Debugging Techniques (The Core Process)
This is where Xcode’s features are leveraged for in-depth analysis:
Breakpoints
- Standard Breakpoints: Pauses execution at a specific line of code.
- Conditional Breakpoints: Only pause execution when a certain condition is met (e.g., a variable count is less than zero, or an if statement’s condition is true). This is essential for bugs that only occur after many iterations.
- Exception Breakpoints: Pauses the app immediately before a runtime exception or crash occurs, allowing inspection of the state before the application terminates. This is often the first step when tackling a crash.
- Symbolic Breakpoints: Pauses execution every time a specific function or method is called, regardless of where it appears in the code (e.g., breaking every time viewDidLoad() is executed).
Code Inspection and State Management
- Stepping: Once paused at a breakpoint, the debugger offers controls to:
- Step Over: Execute the current line of code and move to the next.
- Step Into: Jump into the function being called on the current line.
- Step Out: Finish executing the current function and return to the calling function.
- Variables View and Debug Console (LLDB):
- po Command: The print Object command in the LLDB (Low-Level Debugger) console is used to inspect the value of an object during a pause (e.g., po myVariableName).
- v Command: The generic print variable command.
- Modifying State: The debugger allows you to change the value of variables on the fly to test quick fixes or alternative execution paths without recompiling.
Call Stack Analysis
- The Debug Navigator shows the Call Stack (or Backtrace), which is the sequence of function calls that led to the current execution point. Analyzing the call stack helps determine how the app reached the problematic line of code, especially useful for understanding crashes.
4. Specialized Tooling (Instruments)
For issues that aren’t simple logic errors, specialized tools are required. Instruments is a separate application within Xcode that profiles the app’s performance:
- Memory Leaks: The Leaks instrument detects memory that was allocated but never released, leading to increasing memory usage and eventual crashes.
- Memory Allocations: Helps identify which objects are consuming the most memory.
- Time Profiler: Analyzes the CPU usage of your app, showing which functions are taking the most time and causing slowdowns. Essential for performance optimization.
- Network Activity: Tracks network requests and responses, crucial for debugging issues with APIs and data transfer.
- Zombies: A powerful instrument that helps track down attempts to message a deallocated (freed) object, a common cause of hard-to-find crashes.
5. Fixing, Testing, and Regression
The debugging process doesn’t end with finding the root cause:
- Fix Implementation: Apply the minimal, most targeted code change to resolve the issue.
- Unit and UI Testing: After the fix, run automated tests (if they exist) to ensure the bug is resolved and to confirm that the fix did not introduce new bugs that phenomenon is called regression.
- Continuous Monitoring: For issues that only appear in production, developers rely on third-party crash reporting services (like Firebase Crashlytics or Sentry) to gather crash reports and performance data from actual users, restarting the entire debugging cycle.
Debugging an iOS App With Xcode
Debugging an iOS App With Xcode involves using its integrated tools to pause execution and inspect the program’s state. When a developer encounters an issue, they set a Breakpoint on the suspicious line of code, halting the app when that instruction is reached. Once paused, they use the Variables View to examine the current values of objects and local data, and the Call Stack (Debug Navigator) to trace the sequence of function calls that led to that point. The developer then uses stepping controls (Step Over, Step Into, Step Out) to execute the code line-by-line, observing how the variable values change to isolate the exact logical flaw or incorrect operation.
The second critical component of Xcode debugging is direct interaction via the LLDB Console, located in the Debug Area. While execution is paused, developers use LLDB commands like po (print object) to print the detailed descriptions of complex Swift or Objective-C objects, often revealing internal states that confirm or deny a bug hypothesis. Furthermore, the debugger enables on-the-fly state modification using the expression command, allowing the developer to change a variable’s value to test a quick fix or bypass faulty code without needing to recompile and restart the entire app, drastically accelerating the testing and validation cycle.
A Breakpoint in Xcode is a deliberate marker placed on a line of code that instructs the debugger to pause the application’s execution at that precise moment. This pause is the fundamental mechanism of debugging, allowing the developer to examine the state of the program, including the values of all local and global variables, the order of function calls (the call stack), and the flow of control, all without terminating the app.
Setting the Breakpoint
Setting a basic file-and-line breakpoint is straightforward: you simply click the gutter (the grey column of space next to the line numbers) in the Source Editor where you want the execution to stop. A small blue marker will appear, indicating an active breakpoint.
However, Xcode offers several advanced breakpoint types beyond the basic line stop:
- Conditional Breakpoints: These only pause the execution when a specified Boolean expression evaluates to true. This is invaluable for bugs that only occur after many iterations of a loop or under specific data conditions (e.g., stopping only when a variable index == 10). To set this, you right click the breakpoint, select Edit Breakpoint, and enter the condition in the Condition field.
- Symbolic Breakpoints: These are not tied to a specific line number but to a function or method name (a “symbol”). They pause the app every time that method is called, which is extremely useful for debugging code in third-party frameworks where you don’t have the source file, or for tracking every call to a common method like viewDidLoad().
- Exception Breakpoints: These are generic breakpoints, typically set in the Breakpoint Navigator, that automatically pause execution immediately before a runtime exception or error is thrown. This is often the first step in diagnosing an unexpected app crash, allowing you to inspect the state before the application terminates.
Breakpoints can also be configured with Actions (such as logging a message or running an LLDB command) and can be set to Automatically continue after evaluating actions, allowing them to serve as sophisticated, temporary logging tools without forcing the program to halt.
Can You Debug iOS Apps On An iPhone?
Yes, you can absolutely debug iOS apps on an iPhone (or any other physical iOS device). In fact, debugging on a real device is often necessary because the iOS Simulator, while useful, cannot perfectly replicate all of an actual iPhone’s hardware and real-world conditions (like camera usage, specific sensor data, or true performance).
The primary way to debug an iOS app on a physical iPhone is by using Xcode, Apple’s Integrated Development Environment (IDE), which runs on a Mac.
What Are the Benefits of Debugging an App?
Debugging is essential for producing high-quality software. Its primary benefits center on stability, user experience, and development efficiency.
| Benefit | Impact |
| App Quality & Stability | Debugging eliminates crashes, memory leaks, and logical errors, ensuring the app is reliable and works as expected. |
| Enhanced User Experience (UX) | By resolving issues and optimizing performance, debugging leads to faster, smoother, and more responsive applications, improving user satisfaction. |
| Efficient Development | Catching and fixing bugs early is cheaper and faster than fixing them after a public release, preventing costly hotfixes and saving developer time. |
| Code Integrity | Stepping through the code during debugging forces developers to understand the application’s flow, ensuring that the logic and data manipulation are correct. |
| Performance Optimization | Debugging tools help identify and address bottlenecks, like excessive CPU or energy consumption, leading to a more efficient app. |
Export to Sheets
In short, debugging is the most effective way to guarantee the application is functional, reliable, and provides a positive experience for the user.
Conclusion:
Yes, you can and must debug iOS apps on a physical iPhone. Using Xcode on a Mac to connect to a real device is the definitive method. This process is essential because it allows developers to ensure app stability, check for performance issues, and test hardware-dependent features under true, real world conditions that the Simulator cannot fully replicate.
Debugging is a fundamental practice that guarantees a high-quality user experience.